What We Built

LillieWatch™: multi-sensor monitoring across the Niger Delta.

An operational dashboard built for response, not advocacy. Coverage spans the regional Niger Delta view, six major pipeline corridors, and four export terminal clusters, each with its own calibrated baseline and revisit-based alert layer.

11 Nigerian AOIs

Niger Delta regional overview, six pipeline corridors (TNP, NCTL, Trans Forcados, Trans Escravos, Trans Ramos, Qua Iboe), and four export terminal clusters.

6-Sensor Fusion

Sentinel-1 SAR, VIIRS thermal, TROPOMI SO₂, , Sentinel-2 NDVI, Landsat surface temperature, and high-resolution optical, combined through a calibrated ML classifier for high-confidence detection.

Revisit-Based Refresh

Alert pipeline runs on each usable satellite pass. Cached historical baselines support rapid anomaly detection.

Validated Methodology

Independent technical review by collaborating satellite analytics firms. US validation deployments across Indiana, Louisiana, and the BP Whiting Refinery demonstrate methodology portability.

How It Works

Six sensors. One operational picture.

No single satellite sensor produces reliable crude oil theft alerts on its own. Each has gaps the others fill: clouds defeat optical imagery, thermal detects only active heat, SO₂ requires UV penetration. The trustworthy signal is where multiple sensors agree.

Sentinel-1 SAR
Cloud-penetrating radar
Detects oil slicks on water, surface change along pipeline corridors, and new excavation pits, even through tropical cloud cover.
VIIRS / FIRMS
Day-night thermal
Identifies active fires from artisanal refining and pipeline burning at 375m resolution, twice daily across the full region.
TROPOMI SO₂
Atmospheric chemistry
Captures sulfur dioxide plumes from crude burning, layered onto thermal hotspots for dual-signature confirmation.
Sentinel-2 MSI
Vegetation health
NDVI and NDWI track mangrove die-off, contamination spread, and the visual aftermath of oil spills along the creek network.
Landsat 8/9 TIRS
Surface temperature
Thermal surface-temperature readings corroborate active-combustion and flare signatures at 30 m, backing the VIIRS fire layer.
High-resolution optical
Visual confirmation
Sentinel-2 natural colour and tasked high-resolution imagery to visually confirm each flagged site before it reaches an operator.
In Production

What it actually looks like.

Two views from this week's production runs. The regional dashboard shows multi-sensor metrics at scale. The corridor drilldown shows the same methodology applied to a single pipeline, locating specific candidate combustion sites.

LillieWatch™ Regional Watch showing the Niger Delta core tiled at 0.25 degrees and colour-coded by threat, with a regional posture panel and per-tile detail

Regional common operating picture

The oil-producing belt tiled and scored. Each tile is classified, illegal refining, legal flare, spill, tap, or clearing, and every candidate opens a per-tile breakdown across thermal, radar, optical, gas, and infrastructure context. Revisit-based, not a live feed; candidates are raised for analyst verification, never as confirmed events.

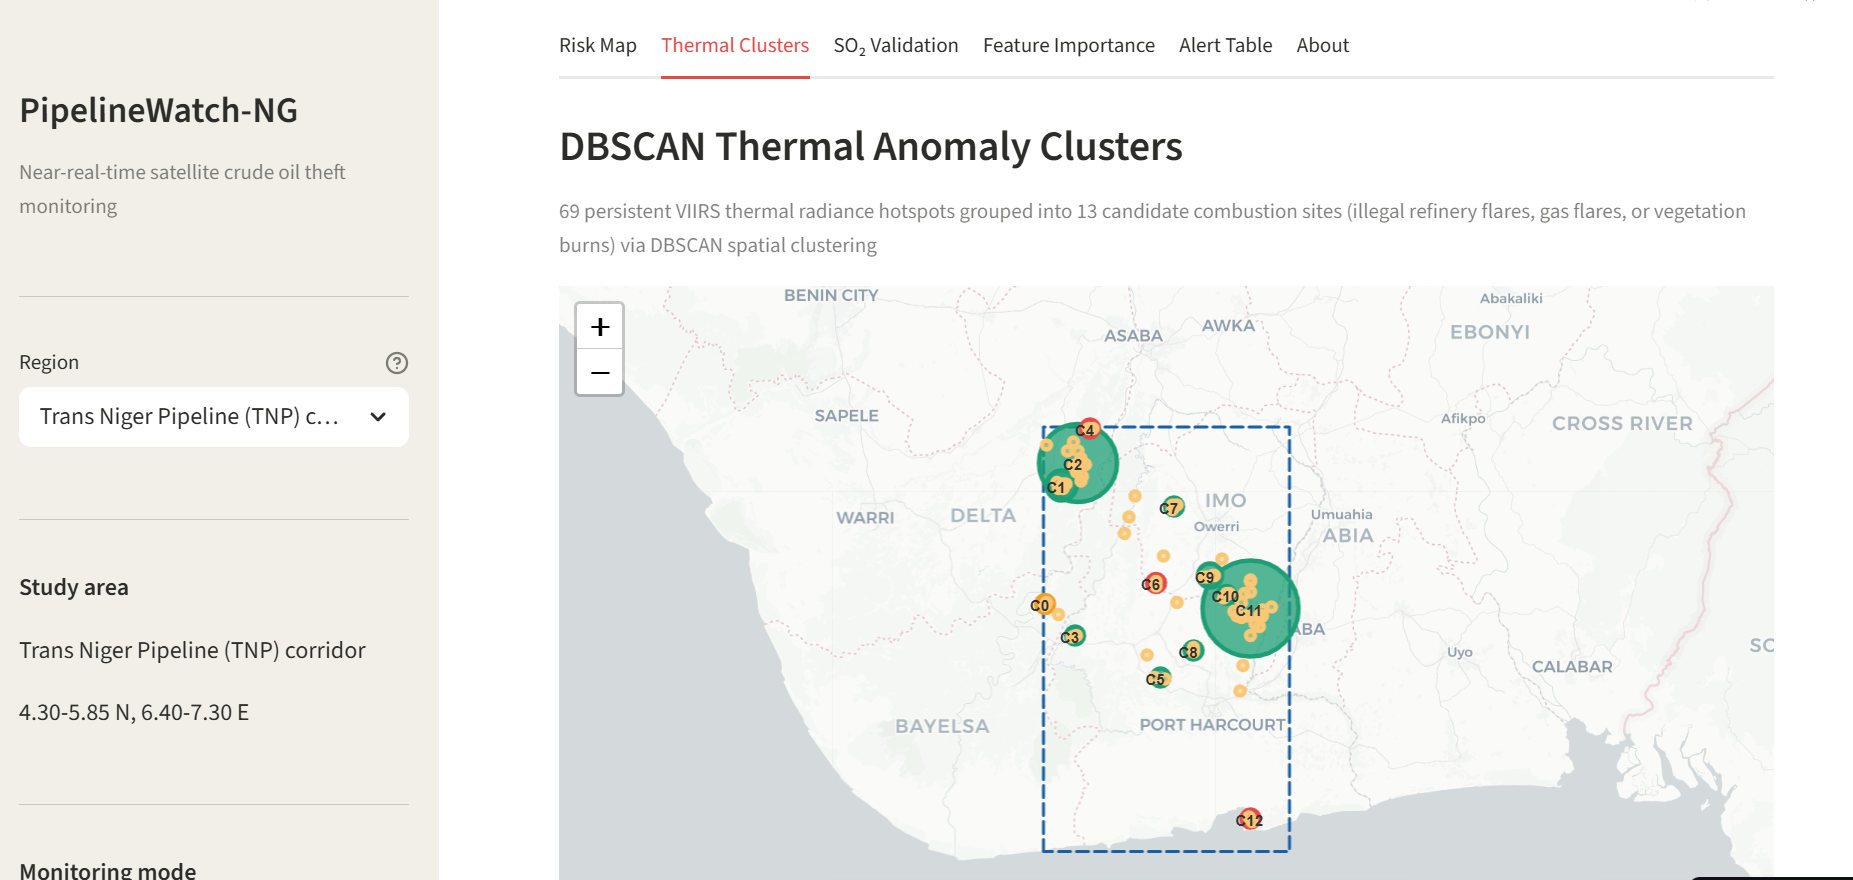
LillieWatch™ Trans Niger Pipeline corridor showing 13 DBSCAN-clustered candidate combustion sites labeled C0 through C12

Corridor drilldown

Trans Niger Pipeline corridor. 69 persistent thermal radiance hotspots grouped into 13 candidate combustion sites via DBSCAN spatial clustering. Each labeled site is a specific lat/lon a patrol could be dispatched to.

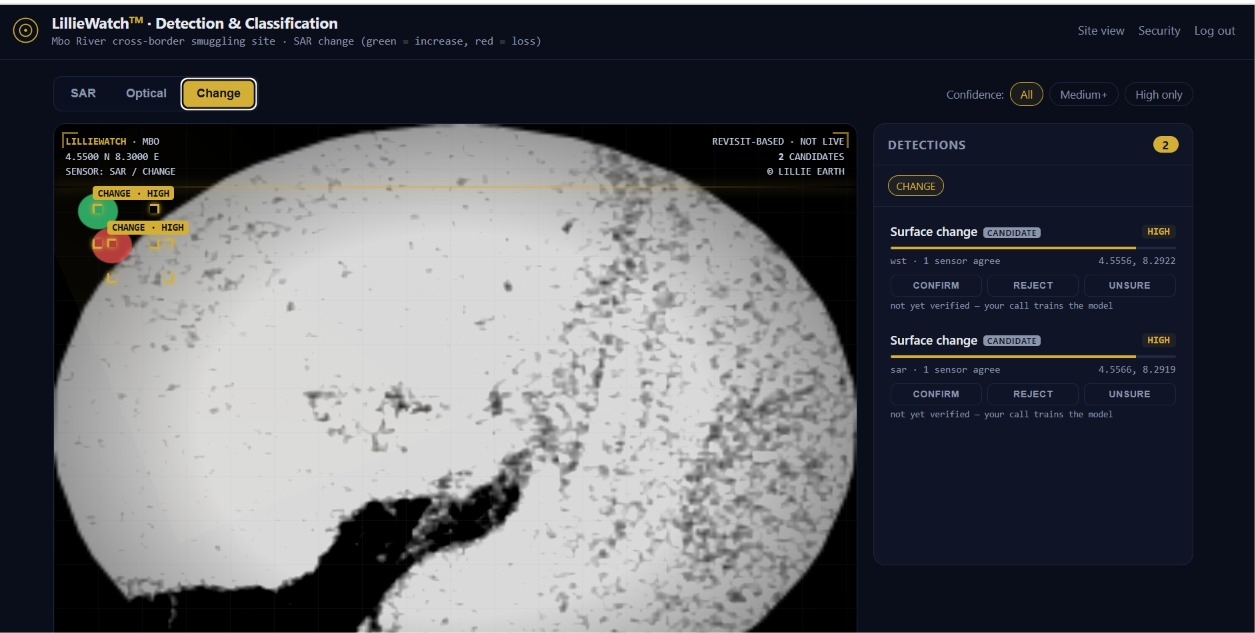
LillieWatch detection console showing SAR change detections at a site with analyst confirm, reject, and unsure controls

Detection and analyst verification

At each site, detections appear as candidates with the sensors that agree and a confidence level. An analyst confirms, rejects, or marks unsure, and every verdict trains the model. Nothing is shown as confirmed until a human has reviewed it.

Operational Capability

Per-site Site Watch. Ground truth before raids. Re-emergence detection after.

The regional dashboard tells you where to look. Site Watch tells you whether what you are looking at is real, and whether it is still there.

Pick a watched location, then watch six weeks of weekly imagery across the core sensors in the same view. Pre-raid: agreement across thermal, SAR, SO2 and NDVI is the signature of a working bunker. Raid week: a coordinated collapse confirms the strike worked. Post-raid: continued silence confirms the site is dismantled; renewed activity on any single sensor flags possible re-emergence and re-tasks the field team.

Bunkers are routinely rebuilt within two to six weeks of a strike. Without a multi-week, multi-sensor view, that pattern is invisible. Site Watch makes it routine.

Example shown: Allison Community / Bonny C12, raided 22 March 2026 by the Nigerian Navy. Six weeks of weekly aggregates around the strike. Verdict on the dashboard: site is quiet.
Sentinel-1 SAR
Sentinel-1 SAR clip showing dark oil slick polygons one week before the raid
W−1
Sentinel-1 SAR clip showing clean speckled water during raid week
W+0 raid
Dark oil slicks suppress radar return on water. They disappear when discharge stops.
VIIRS thermal
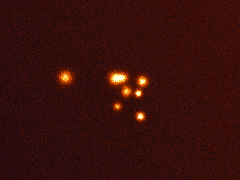
VIIRS thermal clip showing bright fire pixel clusters one week before the raid
W−1
VIIRS thermal clip showing a dark cool field during raid week
W+0 raid
Hotspot clusters mark active combustion. They go dark when the bunker stops burning.
Sentinel-2 NDVI
Sentinel-2 NDVI clip showing a brown refinery scar in the vegetation canopy
W−1
Sentinel-2 NDVI clip showing the scar persisting one week after the raid
W+1
Vegetation scarring persists for weeks after a raid. A trend back toward green is recovery.
TROPOMI SO₂
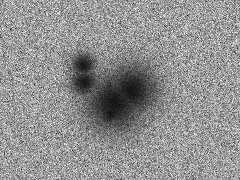
TROPOMI sulphur dioxide plume centred on the site one week before the raid
W−1
TROPOMI sulphur dioxide field with no plume during raid week
W+0 raid
Sulphur plumes confirm crude oil burning. The plume vanishes when combustion stops.
Recent Activity

Real data from the operational cron.

This chart pulls directly from the latest scan output our pipeline has written. No staging, no demo data. It is the same view an operator on our system sees.

Niger Delta region · daily activity
Loading latest data...
LOW alert day MEDIUM alert day HIGH alert day SO₂ max column (DU)

See it running with current data.

The dashboard is the same system described above, running on real pipeline output. Switch between AOIs in the region dropdown.

LillieOre™ — our second product.

The same multi-sensor engine now watches Nigeria's mineral belts: illegal and artisanal mining, reconciled against the national mining cadastre.